RTX
Company information
Name: RTX A/S
Sector: IT
Industry: Communication equipment
Listed at: Small Cap Copenhagen – DK
1-year-historical performance: + 163 %
Activities
The company’s focus area is the design of advanced wireless short-range radio systems and products. The focus is solutions within the technologies of Wi-Fi, Bluetooth, VoIP, DECT and CAT-iq. RTX possess know-how of both soft- and hardware. The company also takes projects from specification, design, development, test and verification into the final product.
The company activities are separated in two main business units. The first: Design Services that entails R&D design partnership of wireless solutions, and delivery of wireless modules with Wi-Fi and DECT radio technologies. The other is Enterprise & VoIP where RTX operates as ODM/OEM supplier of advanced IPtelephony solutions for the Enterprise and SME market.
Share Repurchase
In FY14, RTX A/S bought back DKK 7,9 m. of treasury shares. The reasoning behind the share repurchase program was to adjust the company’s capital structure as well as to cover future share-based remuneration.
The same is held from January 27 to April 30, 2015 where the company again will repurchase shares for an amount of up to DKK 3,0 m.
Furthermore, the share repurchase can be interpreted as a signal from the RTX management that the stock is
undervalued.
Peer Analysis
The Danish company RTX operates in a specialised industry, which implies that the sector is very exposed to company specific risk. Therefore, the Peer Analysis should be carried through with deepest caution, as it might be less accurate than normal.
The companies selected to the Peer Analysis are picked based on the characteristic that they operating within
the subsector of wireless communication equipment and that they have a market cap similar to RTX.
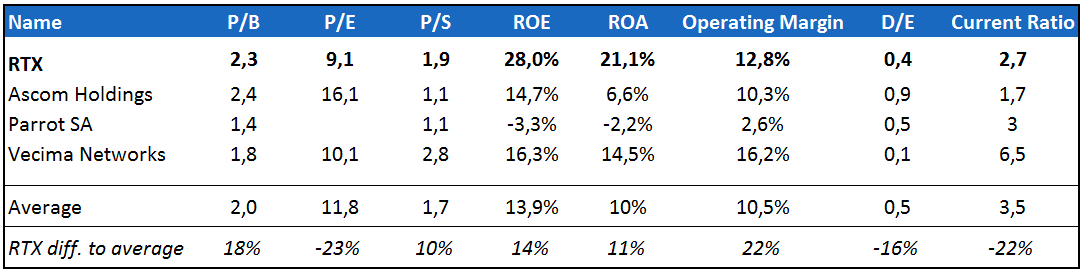
In the figure above, RTX has the highest P/B and P/S with respectively 18% and 10% on average, which might indicate that the company is overvalued. Nevertheless, when looking at the P/E-ratio the company is below the average with 23%, which may not be expensive for a company in this sector. On the other hand, when looking at ROE, ROA and the Operating Margin the profitability indicators beat the peers with two digit on average.
This could indicate that the higher price of RTX based on the P/B- and P/S-ratios’ is justified by a higher profitability. As a conclusion, we believe that RTX is best in class.
Risk
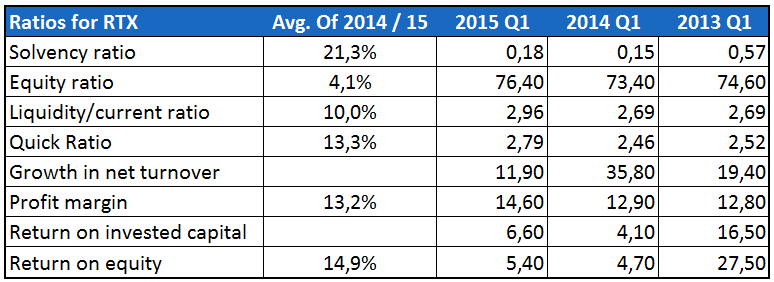
When looking at the figure below for RTX ratios, the solvency ratio proves that RTX is at a stable level with respect to their ability to pay back overall liabilities. Even though they experienced a decline in the ratio in the first part of the 2014, the ratio recovered throughout the fiscal year.
In the same fashion, it is clear from both the quick and current ratio that RTX excel in controlling their liabilities. With both ratios around 2,8 it is clear that RTX is a very stable company who is able to pay their short-term obligations.
Finally, RTX have experienced a steady growth in their net turnover and profit margin. This relation is revealed in their level of ROIC and ROE, which have been at a high level in both the whole fiscal year and the first quarter of each year. This combined shows that RTX is able to generate a profit from their invest capital.
Valuation
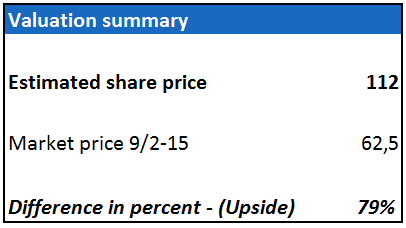
In order to get an absolute price target we apply the DCF valuation method.
Since 2010, RTX has made positive net profits with a strong yearly average growth. Furthermore, the future for the company’s business units possess a strong potential for continued growth. This substantiate a high growth in revenues in the forecast-period of 13%, which we apply in the final valuation.
Since RTX is 75% equity-financed with a stabile risk performance, we use a WACC of 8,5%.
Discounting the cash flows, we arrive at an estimated share price at 112 DKK. Comparing to the current share price as below, this leaves a potential upside of 79%.
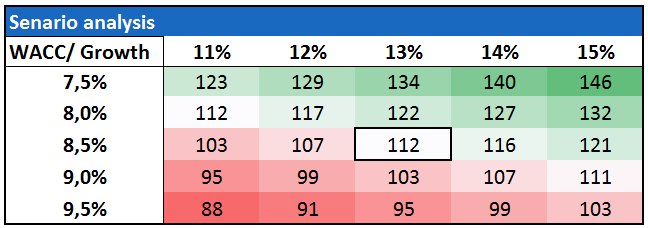
As illustrated below in the scenario analysis, two of the more important variables are used to show the sensitivity when changing the WACC and growth rate with 0,5% and 1%, respectively, at a time. The quick review of changing the two variables shows that the worst-case valuation is a share price of 88 DKK. In turn, the best-case valuation provides a share price of 146 DKK.
Conclusion
We believe that the company’s business units have the ability to grow in the future. The Peer Analysis showed that RTX is best in class, both in terms of risk and operations. With an estimated share price of 112 DKK, and an upside of 79%, the panel recommends: BUY. It can be noted that while producing this article the share price
has already increased to 99,5 DDK as of March 12, 2015 which changes the recommendation from BUY to HOLD.
Authors: Allan Gjerløv Jensen, Anders Bager Rasmussen